From the Sketchbook: "Drawing Assignment I"

One of a series of exercises that I assigned to students in a field sketching course that I taught dealt with solving an illustration problem, the paradoxical nature of which leads to thinking that creates interesting new prospects.

Here's the assignment: using only straight lines (freehand or ruled) depict on a sheet of paper a circular shape.

After you have filled a page with possible responses, view a few of the ones I thought of.

Wildlife Commentary: "North America's Bears"

Three bears currently find space in the Nearctic Faunal Region (North America). Their general descriptions appear on the page shown here from my wildlife textbook.

Because modern humans currently emit more greenhouse gases than they sequester and because they currently destroy more carbon sinks (forests, grasslands, fertile soils, etc.) than they conserve or restore, it is more than likely that by 2100 (or before) there will be only two species of bears living free in the Nearctic region.

Climate change (global warming) that reduces the extent of Arctic sea ice (or reduces it altogether) also reduces/eliminates the principal habitat of polar bears and their chief food source-- seals.  No sea ice, no ice seals, no ice bears.

See the "Climate Feedback Loop 2" (ice-albedo feedback) post (January 4, 2013), and look for future posts on endangered Arctic wildlife species.

"North American Bears" from Fred Montague's wildlife textbook, Wa-Maka-Skan. 

"North American Bears" from Fred Montague's wildlife textbook, Wa-Maka-Skan. 


Gardening Basics: Starting Plants I

I made this quick ink sketch of a 6-pack of lacinato kale seedlings last Sunday (January 27). I started with a rough pencil sketch, refined the best lines with ink, and then erased all of the pencil lines. 

 
A six-pack of kale seedlings. © 2013 Fred Montague

A six-pack of kale seedlings. © 2013 Fred Montague


I "started" these seedlings (that is, I planted the seeds) on December 17th, 2012. This pack, along with five others (broccoli, kohlrabi, Brussels sprouts, bok choy, and Swiss chard), has spent the past month in a flat under a bank of florescent lights in my greenhouse-- a humble lean-to structure along the south side of the garage/print shop.

I usually "start" this set of plants every four weeks, during the waxing crescent moon. Whether or not there is scientific evidence for moon-phase planting, the moon's magic does provide a convenient and regular prompt for planting activities. I plant two seeds per cell (with a pair of forceps). Germination is usually not 100%. In the pack I've illustrated, nine seedlings germinated (75% germination rate). And you can see there is some variability in the time of emergence and in the rate of growth of the seedlings.

Some of these seedlings will be transplanted progressively to larger pots in the greenhouse, then to the greenhouse beds and to 5-gallon buckets.  Some will find their way in early spring into the cold frame and then into the outdoor garden beds. These varieties, along with spinach and a variety of leaf lettuces, are the core plants of our 12-month kitchen garden.

There is another tray of six 6-packs under the lights now with the seeds I planted on January 17th.  And, we are currently harvesting food from greenhouse plants that were sown as seeds last September and October. Succession planting (regularly repeated planting) and sheltered growing spaces (cold frames, greenhouses, sunny kitchen windows, etc.) are key elements in growing food year-round (in temperate climates).

Environmental Commentary: Nuclear Power's Risk

There are numerous valid reasons why commercial nuclear energy is a questionable option for a safe and sustainable economy-- accidents, waste disposal problems, high cost, stock-limited fuels, etc.

Let's examine the risk of major nuclear accidents by looking at nuclear energy's record. The historical record is not an endorsement by nuclear proponents nor a condemnation by anti-nuclear activists.  This is history speaking. In the past 50 years of global commercial electricity generation we have logged nearly 10,500 reactor-years. (A reactor-year is one reactor operating for one year.)

During this time we have experienced three major nuclear accidents:  Three-Mile Island in 1979, Chernobyl in 1986, and Fukushimo Daiichi in 2011.  We are not counting hundreds of lesser incidents at nuclear power stations. The causes of all of these accidents are failures of technology, human error, natural disasters, or combinations of these.

Nuclear power's 50-year record suggests an accident rate of one major peacetime nuclear disaster every 3,500 reactor-years.  We are currently operating 430 reactors worldwide (430 reactor-years per year),  and we should expect a major accident about every 8 years.

If we try to increase nuclear energy's share of commercial energy generation by building more plants, we should expect more frequent accidents.

Since nuclear energy currently provides 15% of the world's electricity (with 433 grid-connected reactors), in order to provide (hypothetically) 100% of the world's electricity we would need a total of 2,866 reactors.  This changes the accident frequency, based on our calculations, to one major accident every 15 months.

Not much has changed, statistically, since I published this FoxSense graphic in 1992.

 
"Fission Creek," from FoxSense. © Fred Montague

"Fission Creek," from FoxSense. © Fred Montague


Gardening Commentary: The Simple Act of Tending a Garden

If you are thinking about growing a garden this year, or if you are a dedicated gardener, sometimes its worthwhile to consider how individual actions can have large beneficial effects. Consider this page from my book Gardening; An Ecological Approach.

"The Simple Act of Tending a Garden," a page from Fred Montague's Gardening: An Ecological Approach. © Fred Montague

"The Simple Act of Tending a Garden," a page from Fred Montague's Gardening: An Ecological Approach. © Fred Montague

Environmental Commentary: "Grow Up, America"

This 1992 FoxSense graphic still seems relevant.

Since 1992, despite some concern over carbon dioxide emissions and climate change, despite moves toward increasing energy conservation and efficiency, and despite slow advances in renewable energy technology, petroleum remains America's "go-to" transportation fuel.

U. S. oil consumption has increased from 2.11 gallons per person per day to 2.41 gallons per person per day.  Collectively we have increased our daily consumption from about 13 million barrels per day (1992) to about 18-19 million barrels per day (2012).

Will this cartoon be applicable in 2025?

 
A comment on U.S. energy policy from FoxSense. © Fred Montague

A comment on U.S. energy policy from FoxSense. © Fred Montague


Environmental Commentary: Disappearing Oil

I recently read in an environmental science textbook that proved oil reserves will be depleted between 2050 and 2100, depending on consumption rates. The commercial press seldom mentions depletion at all, and most politicians either don't know about it or won't talk about it.

On the notebook page reproduced below I have calculated depletion dates between 2020 (case 2) and 2050 (case1). I have shown two of hundreds of possible examples along with their simplistic assumptions. While case 2 (depletion in less than 10 years) will not happen, it does illustrate that the U. S. is a good (or bad) example of resource consumption.

It seems to me, however, that there are at least four obvious trends that favor depletion before 2050.

1. According to resource economics textbooks, we should reduce the amount of proved reserves by 20% because once people realize that we are consuming a fixed amount, the dwindling supply and rising demand will make the last 20% unaffordable. So, the reserves are less than what's estimated.

2. By 2025 the human population will have increased by a billion people. This might affect consumption. From 2025 to 2050 the population is projected to increase again by more than another billion. 

3. Case 1 (below) assumes that consumption remains at 2010 levels until the oil runs out. This seems unlikely, at least for the next few decades. A look at figure 1 (right) from the Vital Signs 2012 chapter cited below suggests that consumption is increasing, especially in the developing world and in the emerging economies (e.g. Brazil, Russia, India, etc.).

Oil consumption trends. From Vital Signs 2012 (cited below).

Oil consumption trends. From Vital Signs 2012 (cited below).

4. The fourth trend for continued consumption is our dogged reluctance to recognize in any practical way the impacts of climate change or of the carbon dioxide emissions from burning oil (43% of total carbon emissions originate from oil use).  

How long will the oil last? © 2013 Fred Montague

How long will the oil last? © 2013 Fred Montague

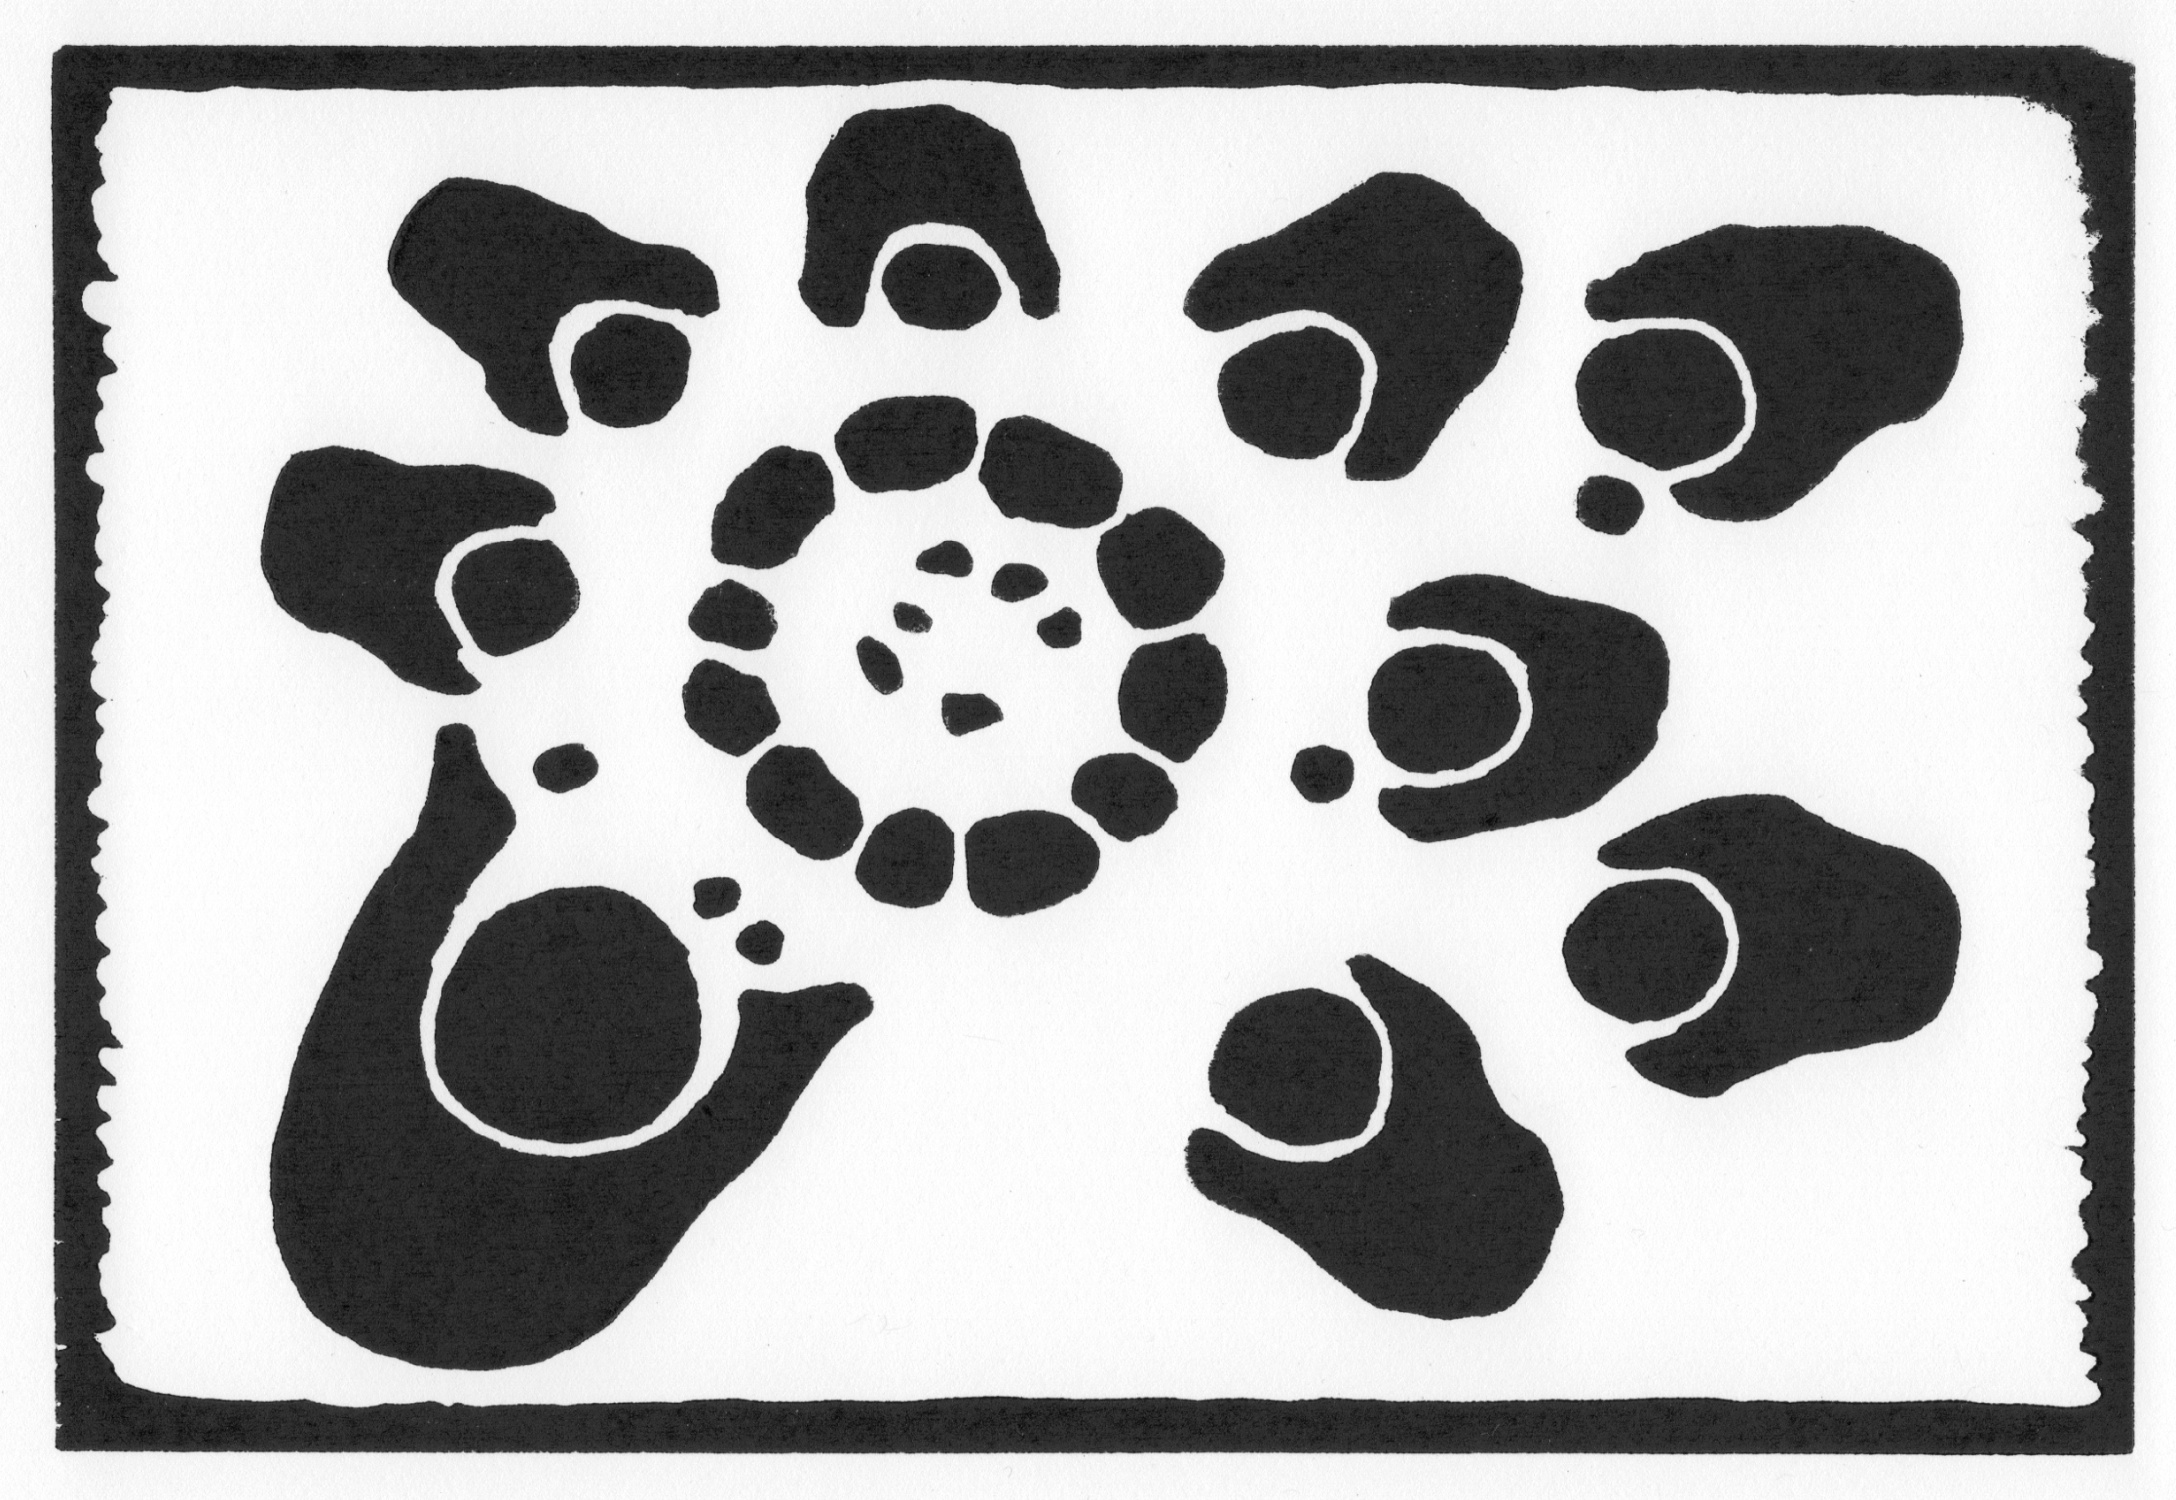
New Work Available: "The Storyteller's Circle"

"The Storyteller's Circle" is my first new woodcut for 2013. Before the recorded word, cultures transmitted their hard-won wisdom and worldviews through spoken stories.  The oral tradition enables people to modify their stories as appropriate to fit evolving situations. They have the potential of handing down guidelines with modification. Spoken stories are adaptable, and they tend to promote adaptable (and adapted) lifeways. 

On the other hand, modern, industrial cultures (with industrially recorded and transmitted information), endeavor to preserve stories, whether they are currently appropriate or not. Recorded stories are institutionally efficient methods of instilling dogma and the others lies and truths we live by.  

Recorded stories for better or worse, are extinction-resistant; oral stories are extinction-prone-- as the storytellers grow old.

Each print in the edition of 88 (printed with my 1913 industrially efficient letterpress) is 8" x 5.5" (matted 14" x 12") and currently sells for $48.

"The Storyteller's Circle," a woodcut by Fred Montague. © 2013

"The Storyteller's Circle," a woodcut by Fred Montague. © 2013

Environmental Science Classroom: Nature as Model

In an essay published in the Winter 2012-2013 issue of Edible Wasatch I attempt to outline the most fundamental of Nature's phenomena, processes, and emergent properties that support life on Earth. What follows are two paragraphs from that essay that explain one of the three phenomena. 

"Sun", a page from Fred Montague's hand-drawn artist book, Garden Grace. © Fred Montague

"Sun", a page from Fred Montague's hand-drawn artist book, Garden Grace. © Fred Montague

"The first is sunlight.  It warms the Earth, evaporates water, causes winds, and powers, directly or indirectly, almost all of us Earth organisms. This energy is free, reliable, and reasonably well-distributed over most of the planet's surface.  Solar power defined our development as a species. And despite our obsession with all sorts of things to burn, react or blow up for bursts of energy (to provide speed, convenience, comfort, or thrills), sunlight still makes up about 99% of all of the energy that flows through the Earth's natural and human-built systems.  Nature's model for sustainability is sunshine-- the same sunshine that spills from the sky over the garden, even in winter."

"With respect to energy in general, and solar radiation in particular, the Earth is an open system.  Energy flows. On balance, all of the energy flowing into the Earth-atmosphere system must rather quickly be re-radiated into space, or else the Earth's temperature will increase.  For stability, 'energy in' must equal 'energy out.' If we impede the flow of heat energy away from the Earth (by enhancing the atmosphere's 'greenhouse effect'), then some of the re-radiated energy (heat) is retained, and the planet warms.  If you've ever been in a closed greenhouse on a summer's day, you know what I'm talking about.  Nature's model with respect to a greenhouse or to the Earth: maintain the normal energy flow to maintain the normal temperature. And in most cases-- especially where organisms or societies are adapted to 'normal,' normal is better than abnormal."  

Read the entire essay at www.edibleWasatch.com

Environmental Science Classroom: Climate Feedback Loops 3 & 4

Here is another unintended effect of our greenhouse gas emissions.  (See the January 4, 2013 post for feedback loop 2.)

Both of the global warming feedback loops shown below involve the potential release of hundreds of millions of tons of methane, currently frozen in tundra soils and shallow ocean sediments.

On a molecule-for-molecule basis, methane is 30 to 70 times more effective than carbon dioxide at trapping heat in the atmosphere.

In an exhibit of chemical irony, after about 12 years in the atmosphere, the methane molecules degrade (oxidize) into carbon dioxide and water vapor-- both important greenhouse gases.

Climate feedback loops 2, 3, & 4 are all positive feedbacks (or runaway feedbacks) and tend to amplify (rather than counteract) the effects of human greenhouse emissions.

Climate Feedback Loops 3 & 4 (methane). © 2013 Fred Montague

Climate Feedback Loops 3 & 4 (methane). © 2013 Fred Montague

On the Drawing Board: "Feathers that Touch the Clouds"

I have been working on this pen-and-ink drawing for several years. It depicts a golden eagle soaring against a bank of cumulus clouds forming over the Uinta Mountains, visible to the east from my garden/studio.

The drawing is large, as my drawings go, 27" by 18.5." The gray smudges and light lines on the drawing-in-progress shown below are the pencil guides for the finished rendering.

Eagle feathers hold special significance for my Native American neighbors, and it is from this special relationship that I have borrowed the title.

I have included a photo from the summer 2012 issue of Continuum magazine that shows the drawing and drawing board.

"Feathers that Touch the Clouds", an in-progress pen-and-ink drawing. © 2013 Fred Montague

"Feathers that Touch the Clouds", an in-progress pen-and-ink drawing. © 2013 Fred Montague

Fred Montague stipples cloud details on "Feathers that Touch the Clouds". Photo by Tom Smart.

Fred Montague stipples cloud details on "Feathers that Touch the Clouds". Photo by Tom Smart.

Environmental Science Classroom: 116-year U. S. Annual Temperature Trend

The graph shown below was downloaded from the U. S. National Oceanic and Atmospheric Administration's National Climatic Data Center website. It includes a summary of temperature records for weather stations in the lower 48 states over the span of time that reliable records have been kept (1895 - present).

The dense black horizontal line (A) represents the 116-year average temperature for the lower 48 states. The gray line (B) represents the temperature trend over the same period. It reveals an overall warming of 1.392 degrees F.

Be cautious about the "average temperature line." It serves merely for reference as the 116-year average.  As the average changes with each year's additional data, this line will go up or down, depending on the new average.  If I were printing the average line, I would have it be a dotted line.  The "trend line," on the other hand, is a smoothed plot of the 116--year net change.

To project this trend forward to 2050 (just 37 years from now) would be to predict a mid-century U. S. average warming of 1.86 degrees F (from 1895 until 2050). If we consider the positive feedback loops that we are discussing (see January 4, 2012 post), there is good reason that the warming will be greater.

If you visit the NCDC website, you can generate 116-year temperature (and precipitation) plots for any state, region, or individual weather station (usually cities, towns, and government facilities).  This could be the basis of a school (or university) term paper or science project. The availability of these data enable everyone to study climate change and monitor global warming.

Graph showing annual average temperature over time in the contiguous U.S., 1895-2011. Generated at NCDC website, accessed January 2nd, 2013.

Graph showing annual average temperature over time in the contiguous U.S., 1895-2011. Generated at NCDC website, accessed January 2nd, 2013.

Gardening Basics: Testing Seeds for Viability

A good winter project is to sort through the caches of seed packets and vials that have accumulated over the years. However, depending on the variety and the age of the seeds, there may be some question whether the seeds are still viable.

Here is a simple way to determine the viability and germination rates of old seeds rather than risking making a fruitless spring planting. This hand-lettered excerpt is from my book Gardening: An Ecological Approach.

Excerpt from Fred Montague's Gardening: An Ecological Approach. © 2009/2013

Excerpt from Fred Montague's Gardening: An Ecological Approach. © 2009/2013

Environmental Science Classroom: Climate Feedback 2

In public discussions about climate change, even among us Americans who understand that it is happening and who acknowledge that we are causing it, the topic usually is limited to carbon dioxide emissions from burning fossil fuels-- coal, oil, and natural gas.  These are the sources for more than 85% of all commercial energy that we use in the U.S. 

By adding carbon dioxide to the atmosphere, we enhance the Earth's greenhouse effect.  The result is that the Earth's atmosphere absorbs heat that normally would be  re-radiated into space.  This is well understood by climate scientists and most others.

What most folks don't know or haven't been told about are the several climate feedback loops that are being set in motion by our planet-warming carbon emissions.  The illustration below briefly explains one of the more apparent feedback mechanisms, the ice-albedo feedback loop.

If most people understood this "run-away" feedback effect, we would probably conclude that even the most drastic emission-limiting proposals are woefully inadequate to deal with the problem of global change.  Here are summaries of three popular approaches that have been advanced by people who care. These have mostly been dismissed as too drastic.

1. We should reduce our carbon emissions to 80% of current levels by 2020.  Or pick any percentage or any year.

2.  We should stabilize atmospheric carbon dioxide concentrations at 350 ppm. Or pick any concentration.

3. We need to be carbon-neutral by 2050.  Or pick any date.

By understanding the climate feedback loops one might conclude that an even more radical approach is necessary-- we must become carbon-negative yesterday.  This means that we immediately emit no more carbon at all and start planting trees to temporarily sequester some of the atmospheric carbon dioxide in plant tissue.  (Of course, we must also revolutionize our land-use strategies.)

These change-enhancing feedback loops take on a life of their own. So, if we stabilize the greenhouse effect today at present levels, the warming and ice-melting trend will continue which will cause more warming and ice-melting, etc. The loop will disappear only after there is no more ice and snow on the planet and after the climate is warm enough that no more snow falls and no ice forms.

We hear from scientists and other observers that global warming is happening faster than predicted.  Most of the predictions have not included feedback loops.

The ice/albedo feedback loop is just one of several that we will discuss later.

Ice/Albedo Feedback Loop Diagram by Fred Montague. © 2012
Ice/Albedo Feedback Loop Diagram by Fred Montague. 

© 2012

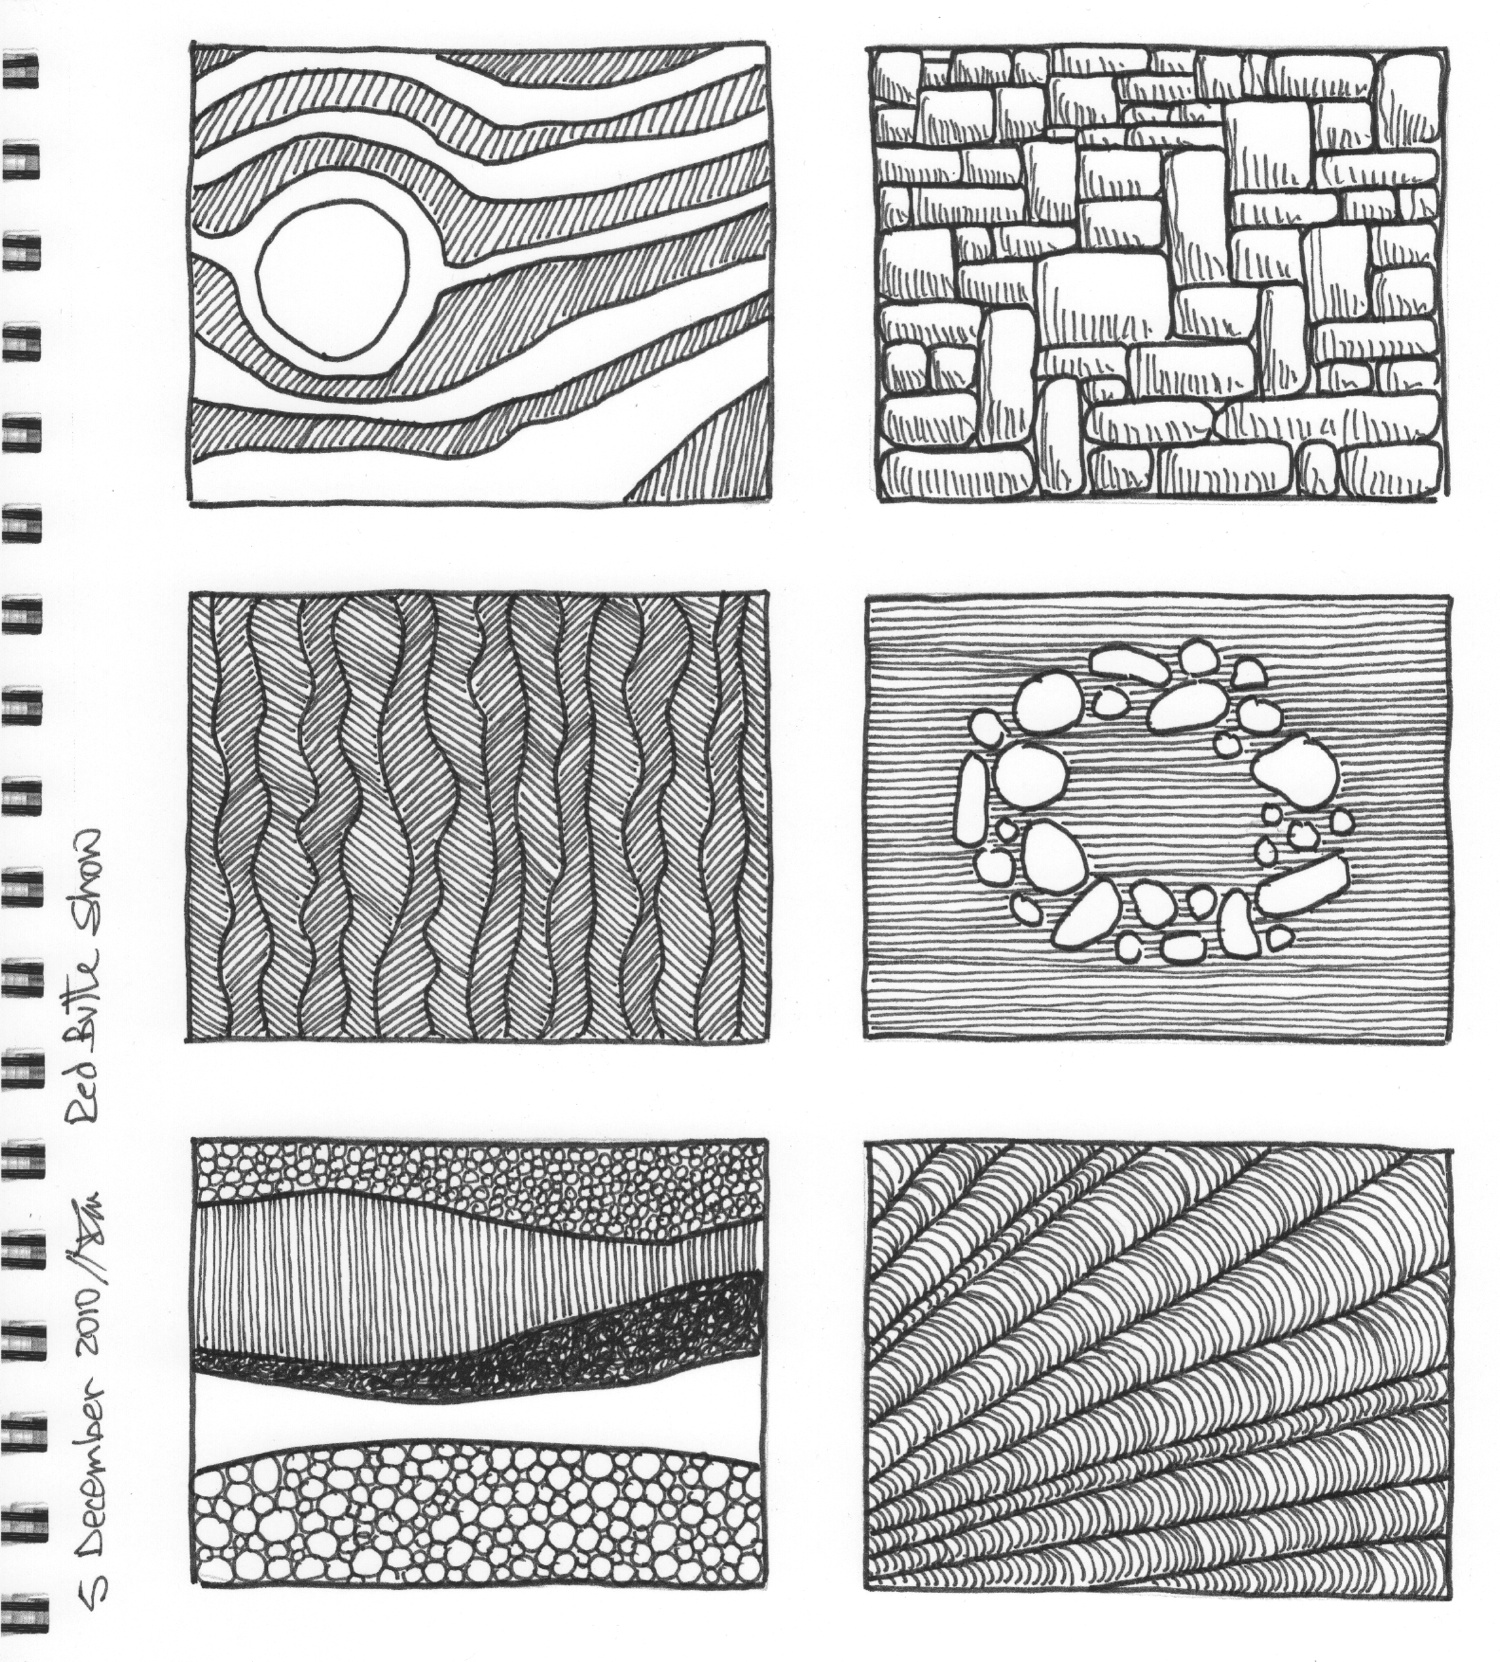
From the Sketchbook

I enjoy exploring the designs, patterns, textures, and motifs that are possible by making black marks on white paper. I usually spend a few minutes a day on most days engaged in this enjoyable (for me) activity.  I have been doing this regularly since I graduated from high school.  The other day I "did the math." 

0.25 hours/day x 300 days a year x 50 years = 3,750 hours.

This is an illustration of the application of the "law of incremental engagement."  It applies to other activities as well.

A page from Fred's sketchbook. © 2013 Fred Montague

A page from Fred's sketchbook. © 2013 Fred Montague

Wildlife Project: Build a Nestbox for Birds

The depth of winter is a good time to build nest boxes for cavity-nesting birds.  Gather some recycled boards and a few hand tools. Old cedar or redwood fence boards are durable and easy to work with, but any type will do. Once you have a cutting plan and a workable prototype, cut out several. They are easy to assemble, especially if you pre-drill the holes and use screws. This makes a good family project.

There are many good reasons for placing nest boxes in the garden, yard, neighborhood, and throughout the countryside.  One is that natural cavities are disappearing as old trees disappear from the landscape.  The second is that native cavity-nesting birds face intense competition, especially in human-occupied areas, from two aggressive alien species-- starlings and house sparrows (English sparrows). Another is that the presence of the native birds, especially around your garden, will help balance out the insect populations.  

Will placing a few nest boxes about the property really have any beneficial effect on native birds? It certainly will on the birds that use them.

The illustration below is a page from my hand-lettered textbook that I used for a university service-learning environmental science course.

A page from Fred Montague's Environment Notebook 2010. © 1999, 2010 

A page from Fred Montague's Environment Notebook 2010. © 1999, 2010 

Environmental Awareness

I use the term "environmental awareness" frequently in my work-- in lectures, in essays, even in the mission statement of my art activities and website.  In the introductory chapter of Gardening: An Ecological Approach I have set out to define the term:

"An 'environmental awareness' is a basic scientific understanding of the physical and biological entities, relationships, and context that actually enable us to live and thrive. This comprehension of context includes recognizing and knowing about environmental features such as our specific geographic location on this particular spinning, tilted, orbiting planet; such as the geology and soil parent materials under the soils upon which we stand; such as the history, topography and climate of our place on Earth; such as the plants, fungi, microbes, and animals that interact in the diverse ecological communities within which we have established our homes and our economic communities; such as the very human actions and artifacts that affect, for better or worse, all of these contextual elements."

"Environmental awareness acknowledges that the two transcending transactions that have maintained life on Earth for the past 3.7 billion years are the thermodynamic beneficence of perpetually flowing solar energy and the on-Earth cycling of materials that permits continual birth and renewal."

"Environmental awareness recognizes and celebrates our intimate and inextricable connection to a set of relatively stable conditions: an atmospheric oxygen concentration of about 21%, a mean global surface temperature of about 59 degrees F, atmospheric and oceanic currents that circulate energy and materials, a benign (until recently) atmospheric 'greenhouse' mechanism, etc.  This level-headed awareness confesses our total dependence on myriad ecological functions, processes, and interactions. These include, for instance, photosynthesis and the fixation of solar energy, decomposition and the recycling of nutrients, soil formation, pollination, climate moderation, water purification, the operation of critical biophysical stabilizing feedback loops, etc.  And, of course, this awareness instills in us a deep affiliation with, and respect for, all other organisms whose participation in these vital processes we can neither assume nor replace nor live without."

--From Gardening: An Ecological Approach, p. 21, © Fred Montague, 2009

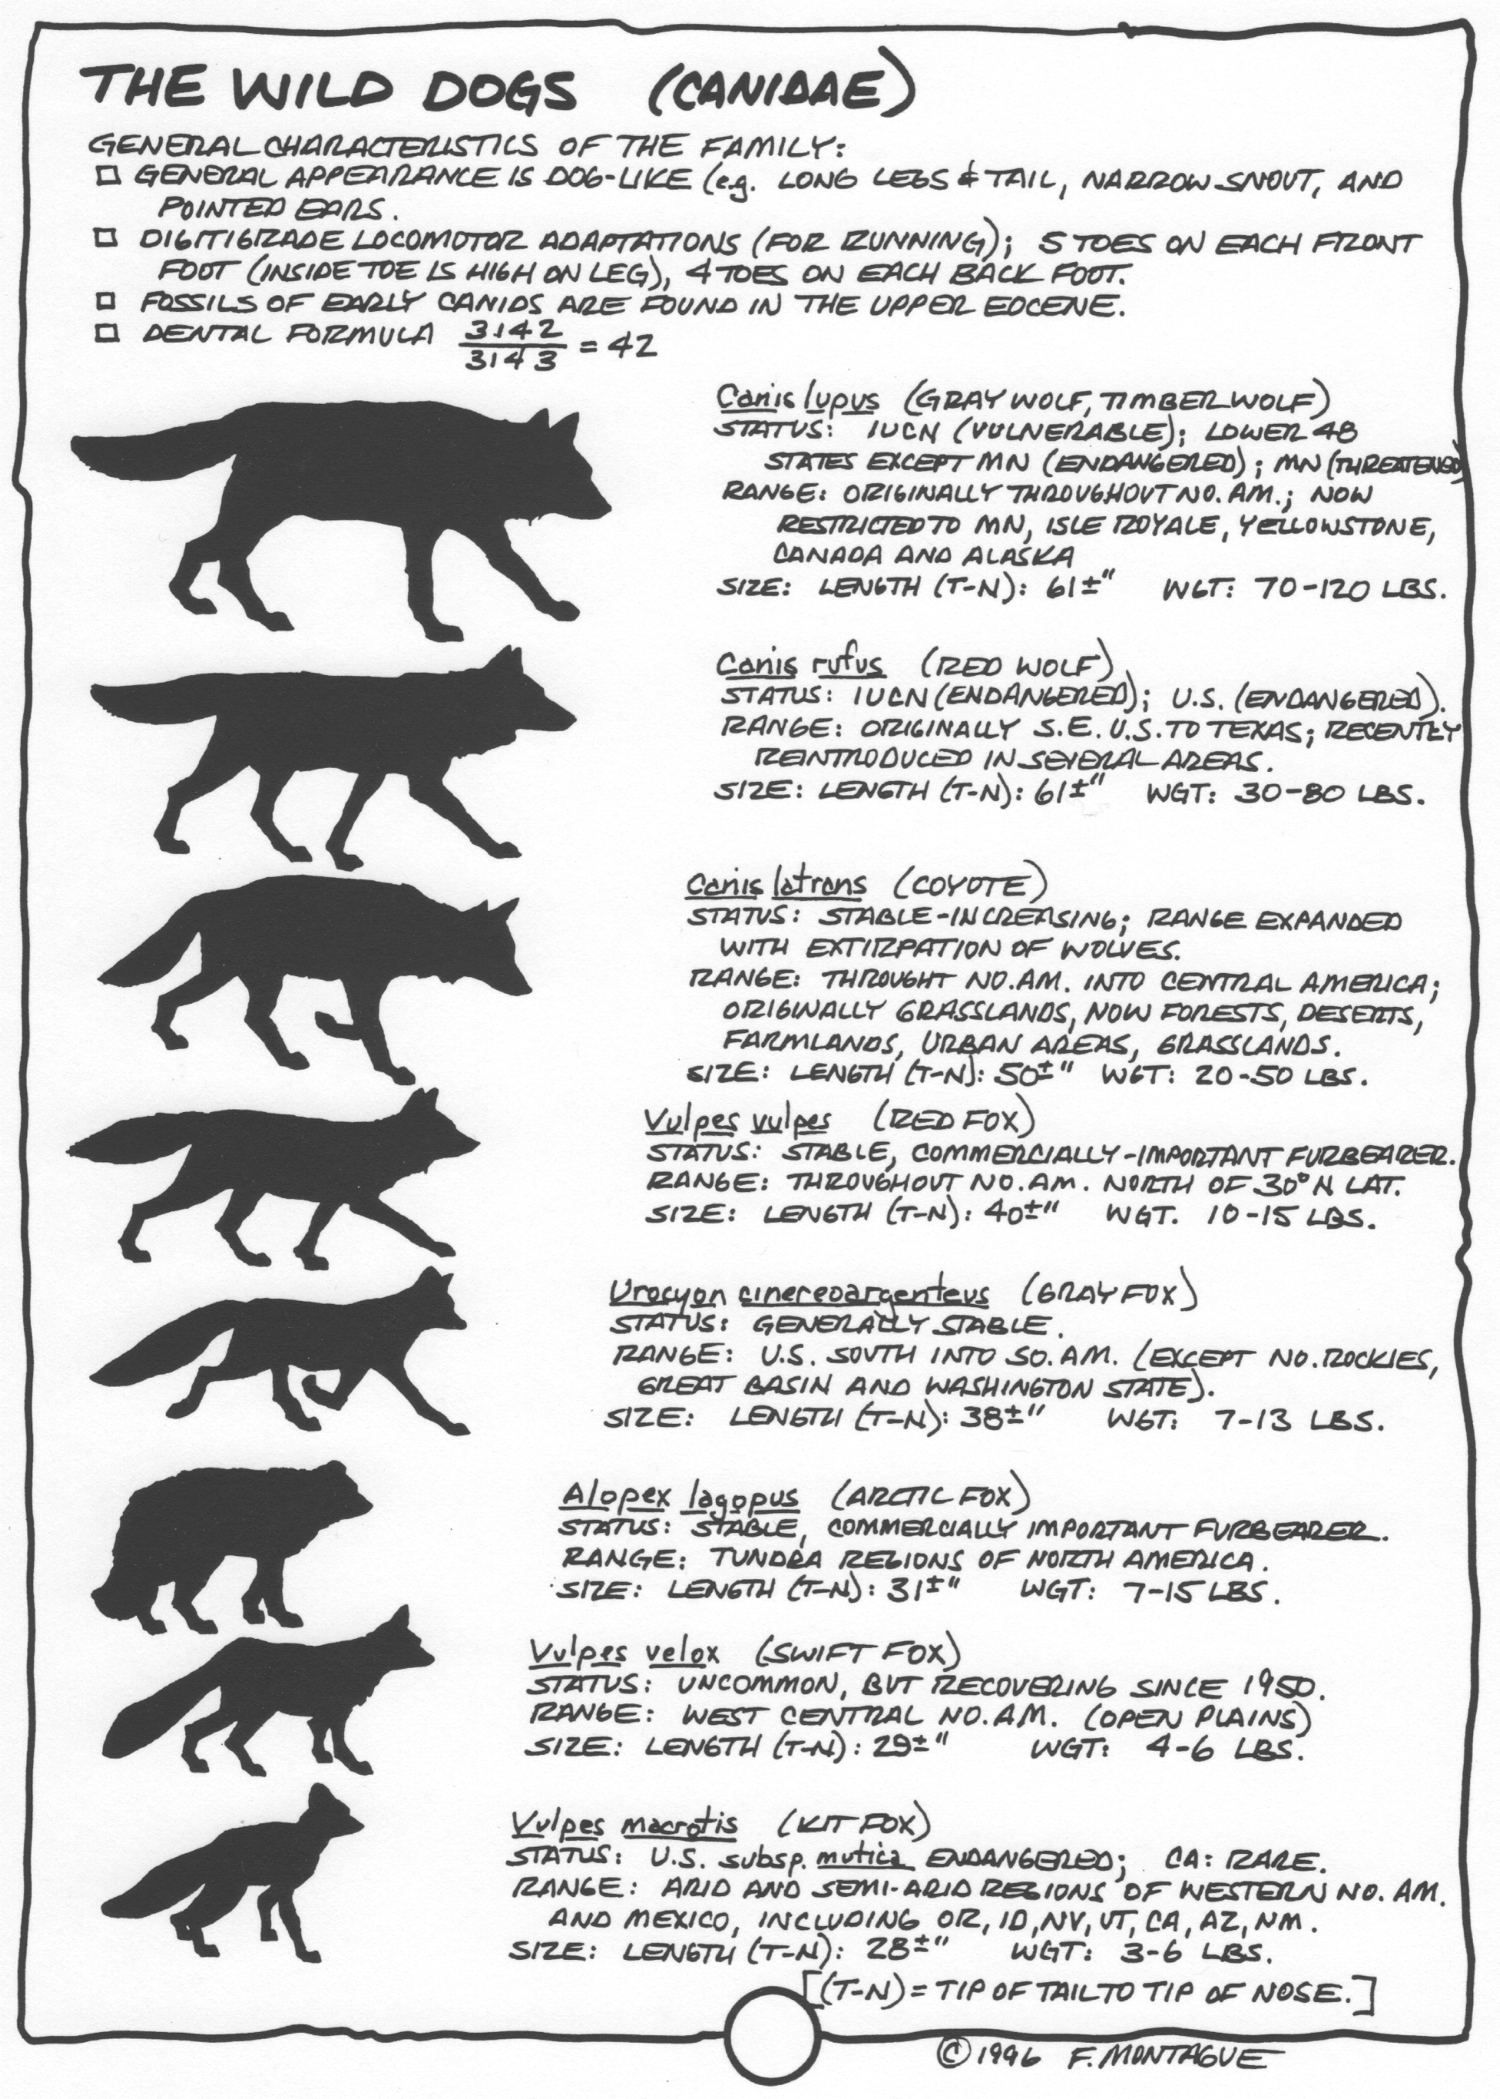
Wildlife Textbook: The Wild Canids

From one of my hand-lettered textbooks titled Wa-Maka-Skan: Fundamentals of Wildlife Ecology and Conservation, this page summarizes the diversity of wild dogs in North America.  These members of the Family Canidae display in their body size and in the sizes of their appendages (e.g. tails and ears) the effects of natural selection operating in various environments (north to south, cold to warm). 

A page from Wa-Maka-Skan, a hand-lettered wildlife ecology textbook by Fred Montague. © 1996, 2012.

A page from Wa-Maka-Skan, a hand-lettered wildlife ecology textbook by Fred Montague. © 1996, 2012.